Reports, also known as report types, are the main components of a connector and define:
How data is requested from the API
How the received data is read and interpreted
What fields are made available in the connector
A connector can have one or multiple report types, and one report type typically requests data from a one endpoint. If you have multiple endpoints you need data from, you can add multiple report types to the connector.
Note
You will need to configure at least one report type to your connector. Otherwise, the connector does not know what data to fetch.
Report type configuration allows you to tailor your connector to fit the requirements of the data source API, be it a simple GET request with JSON response, or a more complex asynchronous reporting flow with a zipped CSV as a response.
How report types are shown in Supermetrics
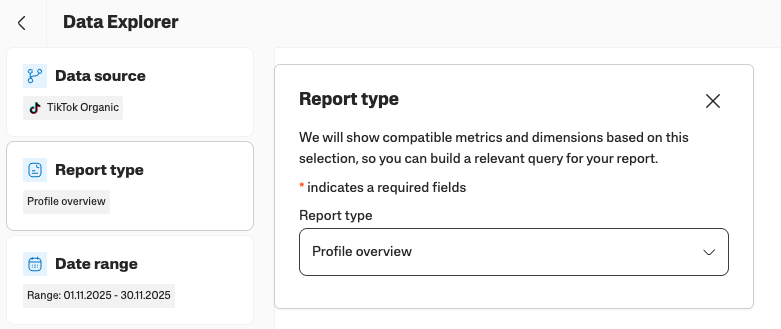
Report types are visible for the user when they’re building a query in Supermetrics products. All the configured report types are selectable as a dropdown after authenticating to the connector.
Structure of report type configuration
Your connector can have one or multiple report types that are configured as an array under the reporting object.
"reporting": {
    "reportTypes": [
        {
            "id": "report_type_1",
            "title": "1st report type"
        },
        {
            "id": "report_type_2",
            "title": "2nd report type"
        }
    ]
}
Under each report type, you can then define report type-specific requests, settings, configurations, and fields.
Below, we’ll walk you through all the most essential configuration options.
Basic configurations
Field | Description |
|---|---|
| Report type ID is used to identify report types. The report type ID must be unique, and it can contain:
For example: |
| The report type title defines the display name for the report type, and it’s shown to the user in Supermetrics products. |
| The
See the Date range configuration section for more details |
| The See Request configuration and Transforming response structure for further details. |
| Settings available for the user of the connector, which can be used to alter requests. For example, if the API allows a currency parameter to be passed as part of the request, you can define a dropdown of currencies for the user to select, and then pass the selected currency to the API request via a placeholder. |
| Under metrics, you can define an array of metric fields to be available in the connector. Metric fields are aggregated during the data processing. See field configuration for more information. |
| Under dimensions, you can define an array of dimension fields to be available in the connector. Dimension fields allow you to split your metric data into segments. See field configuration for more information. |
Date range configuration
Most of the datasets that you work with contain one or multiple date values, for example:
Campaign performance data broken down by date
Ecommerce order data containing order creation date, modification date, and shipping date
Most APIs also allow you to filter the data by date in the data fetching request. In this section, we’ll show you how to configure date range filtering for your connector.
Configuring date range filtering involves a few steps:
Enabling date range filtering and default date fields in the connector
Configuring start and end date parameters to be sent as part of the request
Defining the field that’s used to filter the data by date
Let’s go through each of the steps.
Step 1: Enable date range filtering and default date fields in the connector
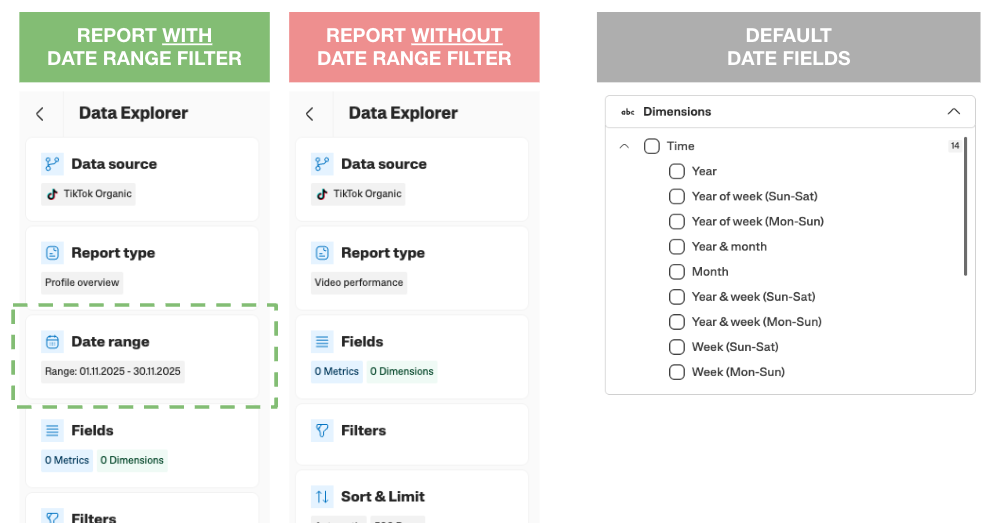
For the connector to show a date range selection when building a query, the date range filtering must be enabled in the connector. Below you can see an example of how a report type with or without date range filtering looks when using a connector. When the API provides date-based data, we also usually configure a default set of date fields to be available for the user of the connector, which allows users to aggregate the data for different time granularities (date, week, month, year, and so on).
To enable showing the date range selection and default date fields in the connector, configure showDateRange and showDefaultDateFields under config for a report type. Like this:
"reporting": {
    "reportTypes": [
        {
            "id": "campaign_performance",
            "title": "Campaign performance",
            "config": {
                "showDateRange": true,
                "showDefaultDateFields": true
            }
        }
    ]
}
Step 2: Configure start and end date parameters to be sent as part of the request
When the connector shows the date range selection, we want to ensure that whatever the user selects as the date range of the query, is also sent as part of the API request. This is done using placeholders in the request configuration.
Let’s assume that the API we’re using accepts starting_from and until_to parameters to define the date range for which data is returned, and the date must be sent in the YYYY-MM-DD format. The report configuration would look like this:
"reporting": {
    "reportTypes": [
        {
            "id": "campaign_performance",
            "title": "Campaign performance",
            "config": {
                "showDateRange": true,
                "showDefaultDateFields": true
            },
            "request": {
                "method": "GET",
                "url": "https://api.example.com",
                "parameters": [
                    {
                        "name": "starting_from",
                        "value": "{{query.start_date_time.date}}"
                    },
                    {
                        "name": "until_to",
                        "value": "{{query.end_date_time.date}}"
                    }
                ]
            }
        }
    ]
}
Step 3: Define the field used for filtering the data by date
When we’re successfully sending the date range filtering parameters to the API, and we have configured a set of ready date fields for the user to aggregate the data for different granularities, we next need to explain to our system which field to use as a base for all the date operations.
Let’s assume the API returns order data, and you want the orders to be aggregated by order creation date. This order creation date is returned in the API response in the date_of_order value. We’ll configure:
A dimension for Order date with the following details:
Display name (label):
Order dateID:
order_dateData type:
string.time.dateValue for the field to come from
jsonPath(JSON response provided by the API), and we read the value from thedate_of_orderfield
We configure
readDateFromunder theconfigobject to pinpoint to thisorder_datefield we just created.
The full configuration would look like this:
"reporting": {
    "reportTypes": [
        {
            "id": "campaign_performance",
            "title": "Campaign performance",
            "config": {
                "showDateRange": true,
                "showDefaultDateFields": true,
                "readDateFrom": "order_date"
            },
            "request": {
                "method": "GET",
                "url": "https://api.example.com",
                "parameters": [
                    {
                        "name": "starting_from",
                        "value": "{{query.start_date_time.date}}"
                    },
                    {
                        "name": "until_to",
                        "value": "{{query.end_date_time.date}}"
                    }
                ]
            },
            "dimensions": {
                "groups": [
                    {
                        "label": "DIMENSIONS",
                        "fields": [
                            {
                                "id": "order_date",
                                "label": "Order date",
                                "dataType": "string.time.date",
                                "value": {
                                    "source": "jsonPath",
                                    "value": "$.date_of_order"
                                }
                            }
                        ]
                    }
                ]
            }
        }
    ]
}
Field configuration (metrics and dimensions)
Configuring the fields for your connector is an essential part in defining what data is available in the connector. Fields are divided into two categories:
Dimensions: Descriptive attributes used to segment data, splitting your metrics into different categories. Common dimensions include, for example, campaign, country, device, contact ID, and order time.
Metrics: Quantitative measurements used to provide specific numbers about behavior or performance. One way to think about metrics is that you can apply mathematical operations to them, such as summing them or calculating an average. Common metrics are, for example, spend, impressions, clicks, click-through rate, conversion rate, cost per acquisition, and return on investment (ROI).
When configuring fields to your connector, you need to configure each field under dimensions or metrics , so we know whether the field should be used to segment or to aggregate your data. You can configure as many fields in your connector as you want.
Example configuration for fields split to dimensions and metrics looks like this:
 {
    "dimensions": {
        "groups": [
            {
                "label": "DIMENSIONS",
                "fields": [
                    {
                        "id": "campaign_id",
                        "label": "Campaign ID",
                        "dataType": "string.text.value",
                        "value": {
                            "source": "jsonPath",
                            "value": "$.campaign_id"
                        }
                    }
                ]
            }
        ]
    },
    "metrics": {
        "groups": [
            {
                "label": "METRICS",
                "fields": [
                    {
                        "id": "impressions",
                        "label": "Impressions",
                        "dataType": "int.number.value",
                        "value": {
                            "source": "jsonPath",
                            "value": "$.impressions"
                        },
                        "aggregationType": "sum"
                    }
                ]
            }
        ]
    }
}
Field properties
Below you can find what different properties you should configure for your fields.
Property | Description |
|---|---|
| The unique identifier of the field. It’s recommended to set this to be the API field name. Only lowercase letters, digits, and underscores are allowed. |
| The display name of the field. The display name is shown to users in Supermetrics products. |
| The description shows up as a tooltip when hovering over the field in Supermetrics products. |
| Data type of the field. Each field needs to be mapped to one of the pre-defined data types used across Supermetrics products. This ensures that we’re able to handle the data correctly and send it in a correct format to the destination you want to use the data in. Most common data types include:
All the available data types are documented here. |
| Value defines how we get the value of the field we return to the user. This is defined as A most common configuration is to have |
| ONLY FOR METRICS FIELDS
Available options:
|
Combining data from multiple report types
When a single report needs fields from more than one API endpoint, you can join data across report types so the final rows include fields from each. The parent report type contributes the base rows, and one or more child report types contribute additional fields on each row.
This is configured under the decoration property of the parent report type. The child report types are usually hidden from the connector – the user only sees and selects the parent report, and the joined fields appear alongside the parent's own fields on each row.
See Joining data for the patterns (one-to-one and one-to-many joins, batching of child requests to cut down API calls, and chaining joins across multiple report types).
Report type configuration template
"reporting": {
    "reportTypes": [
        {
            "id": "[report_id]",
            "title": "[report_id]",
            "request": {
                "method": "GET",
                "url": "[endpoint URL]",
                "headers": [
                    {
                        "name": "Authorization",
                        "value": "{{user.access_token}}"
                    }
                ],
                "parameters": [
                    {
                        "name": "start_date",
                        "value": "{{query.start_date_time.date}}"
                    },
                    {
                        "name": "end_date",
                        "value": "{{query.end_date_time.date}}"
                    }
                ],
                "response": {
                    "type": "JSON",
                    "dataRows": {
                        "source": "jsonPath",
                        "value": "$[json path to data rows in the response]"
                    },
                    "pagination": {
                        "type": "none"
                    }
                }
            },
            "dimensions": {
                "groups": [
                    {
                        "label": "Dimension group name",
                        "fields": [
                            {
                                "id": "field_id",
                                "label": "field display name",
                                "dataType": "string.text.value",
                                "value": {
                                    "source": "jsonPath",
                                    "value": "$[jsonpath to field in API response]"
                                }
                            }
                        ]
                    }
                ]
            },
            "metrics": {
                "groups": [
                    {
                        "label": "Metrics group name",
                        "fields": [
                            {
                                "id": "field_id",
                                "label": "field display name",
                                "dataType": "int.number.value",
                                "aggregationType": "sum",
                                "value": {
                                    "source": "jsonPath",
                                    "value": "$[jsonpath to field in API response]"
                                }
                            }
                        ]
                    }
                ]
            }
        }
    ]
}